[This is part 1: part 2 adds a control valve model, part 3 adds a controller.]
Consider a simple tank as follows ...
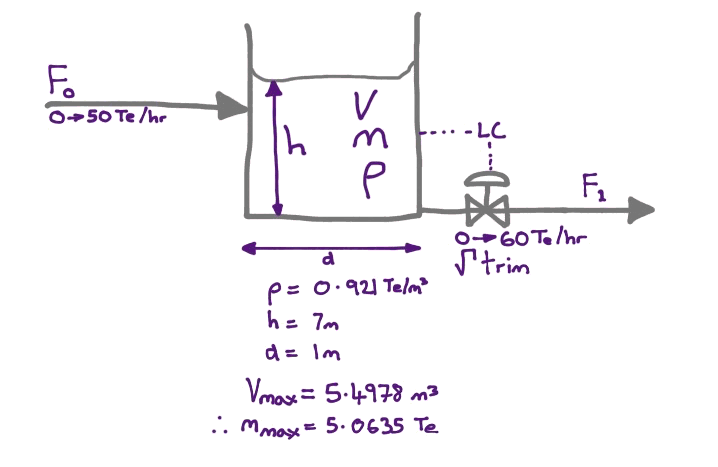
How do we develop a dynamic Scilab model of this?
You can download the completed version with this link.

Step 1: Classify variables
By this I mean which are given and which need to be determined by the model. In this case;
- FlowIn, FlowOut will be specified by input variables to the model
- Density, tank height, tank diameter are fixed and defined by the plant specification
- Liquid height and height in percent will be determined by the model
In other words, given the variations of flow in and flow out the model will determine how the liquid height changes over time.
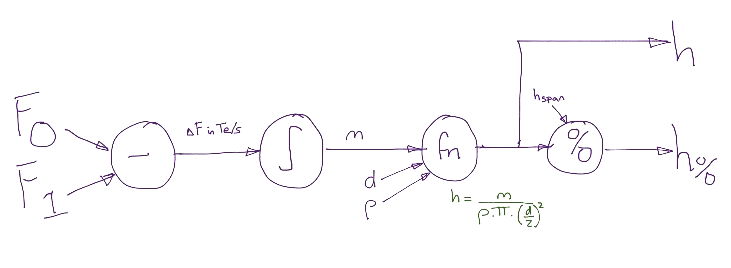
Step 2: Draw a data-flow diagram (DFD)
The data-flow diagram helps to determine the calculation order and I find it a useful step between the calculations and how they are implemented in Xcos.
This step identifies a model variable since the integration function needs an initial value. This initial value represents the starting state of the tank In this case we will decide to provide the initial tank mass as the initial value for the integral function.
Step 3: Translate DFD to Scilab model
Building this DFD in Xcos leads to...

Step 4: Test the model - does it behave like real life?
This is of course the most important part. Is your model good enough for the purpose intended?
I have found the best approach is to derive test data with expected results once the previous step is complete. Experience helps in deriving test data but the aim should be to exercise all the modes of operation, which in this case is;
- FlowIn = FlowOut: should give steady level
- FlowIn > FlowOut: tank should fill to its maximum height at a steady rate
- FlowOut > FlowIn: tank should empty to zero at a steady rate
- FlowIn a sine wave, FlowOut fixed: tank level should be a sine wave
In order to perform the test we have to add some bits to our tank model. I did this by making the Xcos tank model a superblock and then added the inputs to set the flow in and flow out together with a trend so I can see the tank height. This resulted in...
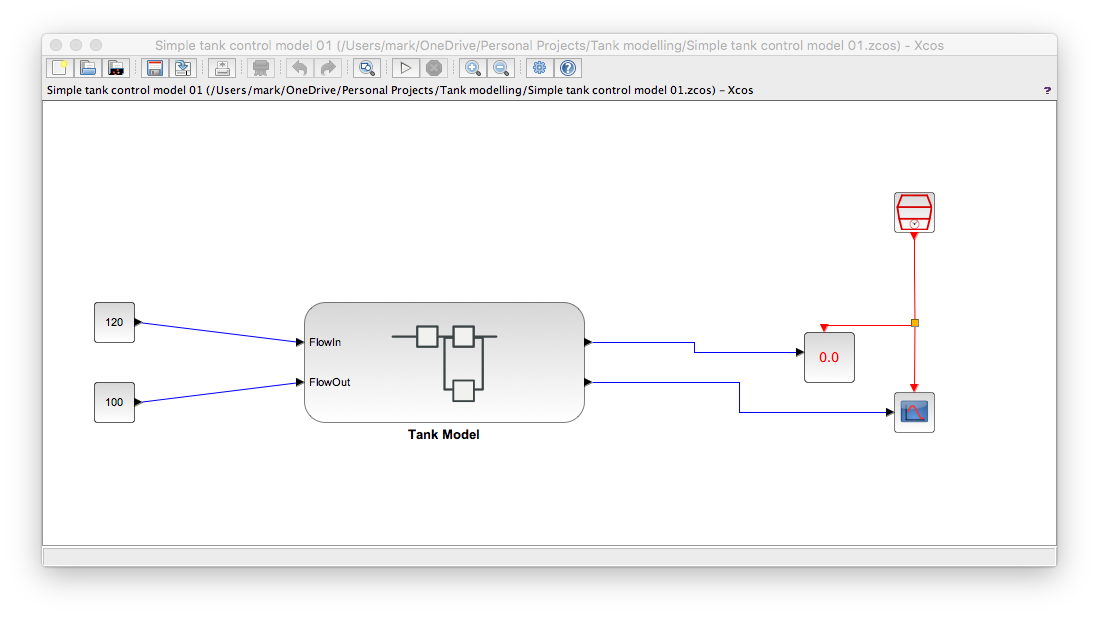
And I used context variables as follows...
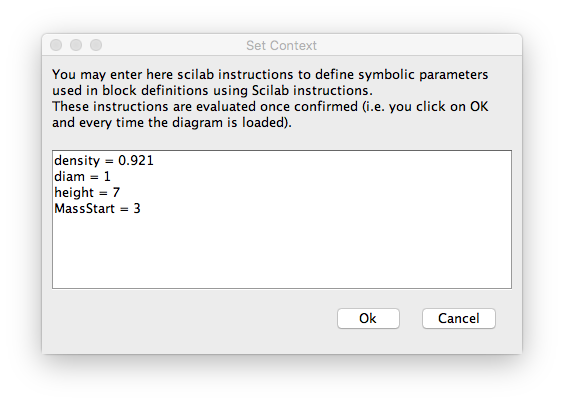
So what does this test data produce on our model above.
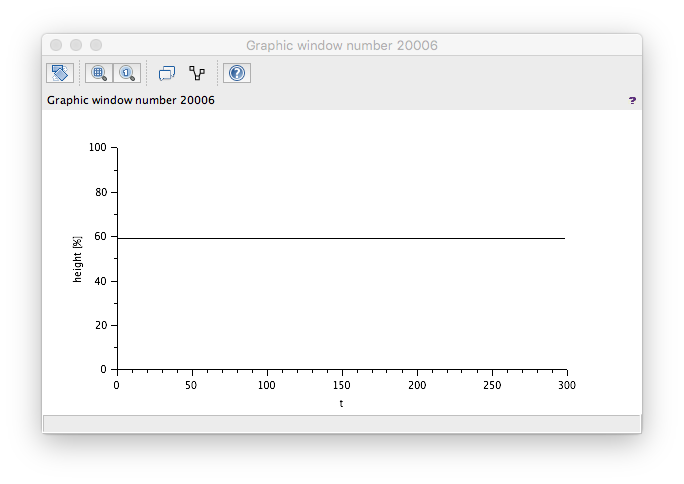
FlowIn = FlowOut
As expected - flat.
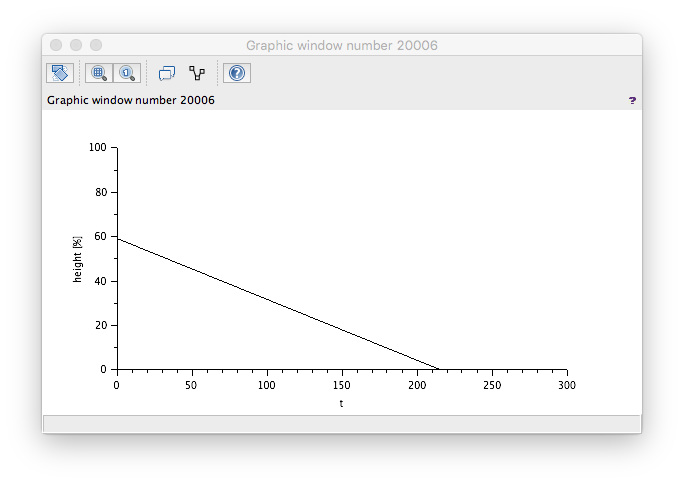
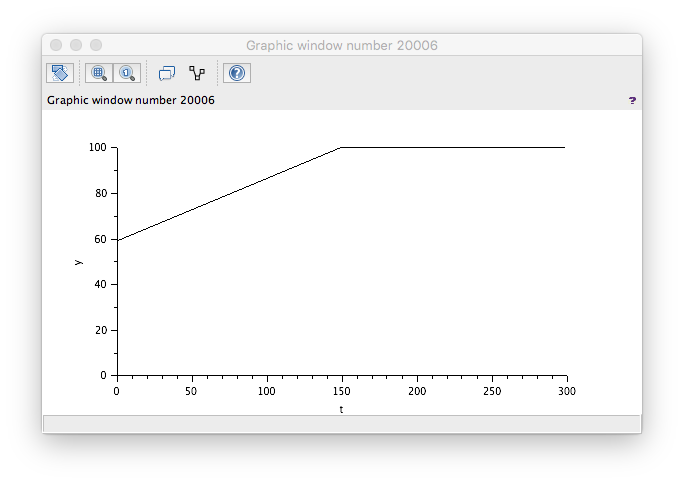
FlowIn > FlowOut
Wrong! The level is decreasing even though our flow in is greater than our flow out. A check of the model reveals the wrong sign used to generate the Te/s value. Changing these round to...

...yields the correct result. Note too that there is a ceiling at 100% - which is correct.
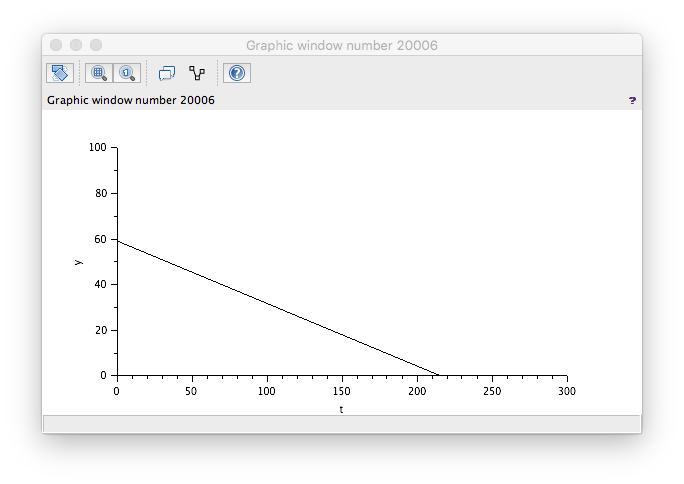
FlowOut > FlowIn
That looks correct.
FlowIn sine wave test
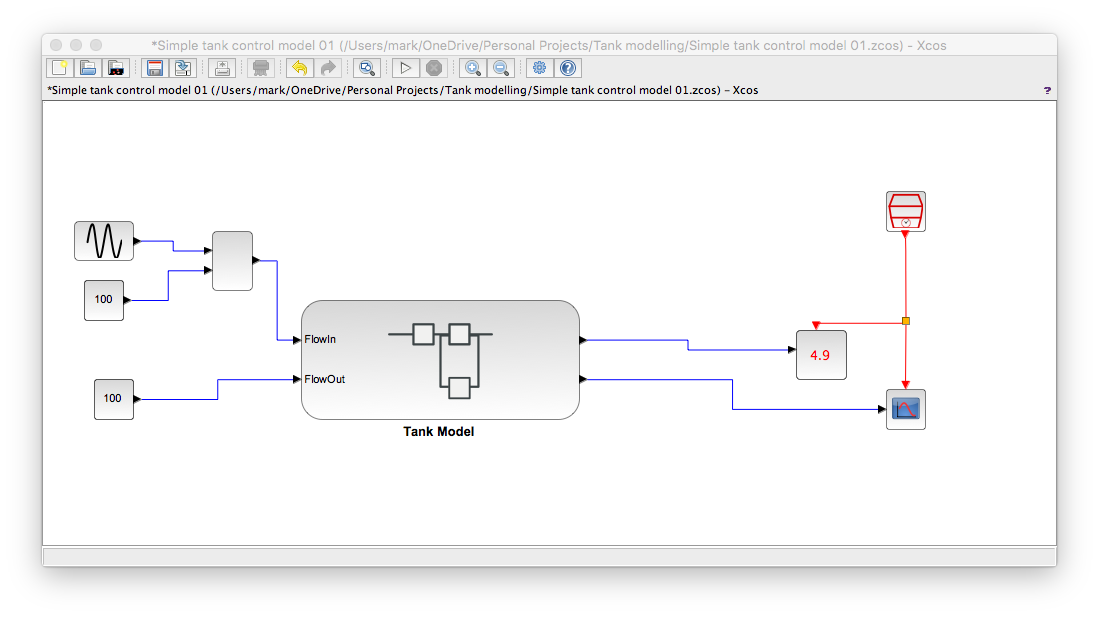
We need a quick modification to be able to do this test. You can't get a sine block to oscillate around a central value so you have to add a sine block output to a constant like this...
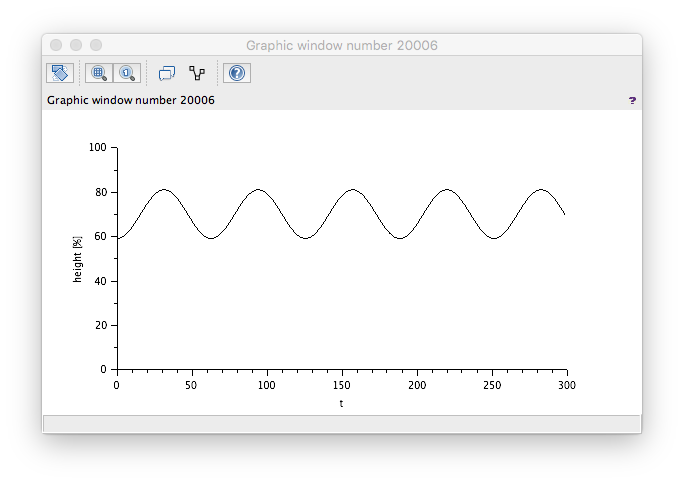
And with some suitable values you get...
Which is correct too. A sine wave flow in of low-ish frequency should produce a sine wave effect on the level.
Conclusion
Our tank model passes the tests so we can now develop it further;

